GDP of Russia, the USA and China. Unexpected comparison
Data on the gross domestic product (GDP) of any country is largely an illusion. In order to see the real situation, you need to look at least at two things: GDP at PPP - purchasing power parity, and the very structure of GDP.
PPP makes it possible to estimate the real volume economics without reference to the dollar, as well as the real standard of living in the country. A knowledge of the structure of the gross domestic product of the country allows you to highlight the volume of the real sector, i.e. actual manufactured product in various industries: mining and manufacturing.

There are more complex translation techniques, including more parameters that we do not consider here.
So, let's compare the GDP of Russia, the USA and China and draw some unexpected conclusions.
Gross domestic product at purchasing power parity in billions of dollars (IMF data for 2016)
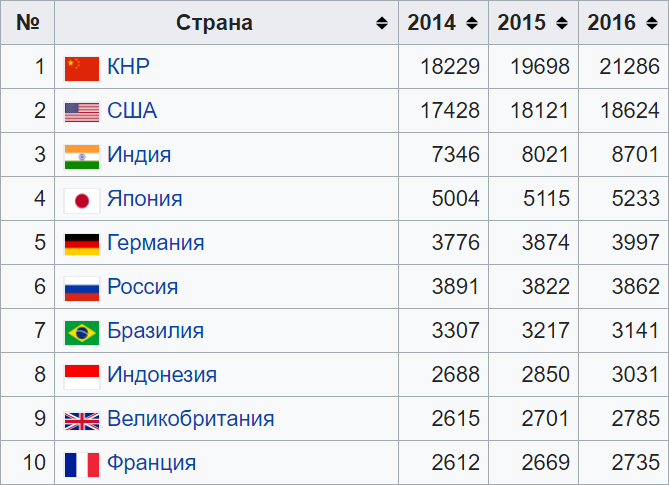
GDP structure
USA. Industrial production - 15%, agriculture and fisheries - 1%, construction - 3%. Total real sector - 19%. The rest is trade and various kinds of services: from manicure to transport and financial.
China. Industrial production - 40%, agriculture - 10%, construction - 7%. The share of the real sector is 57%. It turns out that the size of the real sector of China's economy is almost three times larger than the American one.
Russia. Industrial production - 30,5%, agricultural and fishing - 4,2%, construction - 7,4%. Total - 42.1%
So, let's count. US GDP is 4,8 times more than ours, and the specific share of real production in Russia's GDP is 2,2 times higher than in US GDP. This means that real industrial production in the USA is 4.8 / 2.2 = 2.18 times larger than ours. And if we take into account the shadow sector, which in Russia is significantly larger than in the US, the gap will become even less noticeable.
A similar calculation for China shows that the volume of the manufactured product there is 7,44 times higher than ours.
In terms of per capita, we come to interesting and unexpected conclusions.
Country Population 2017
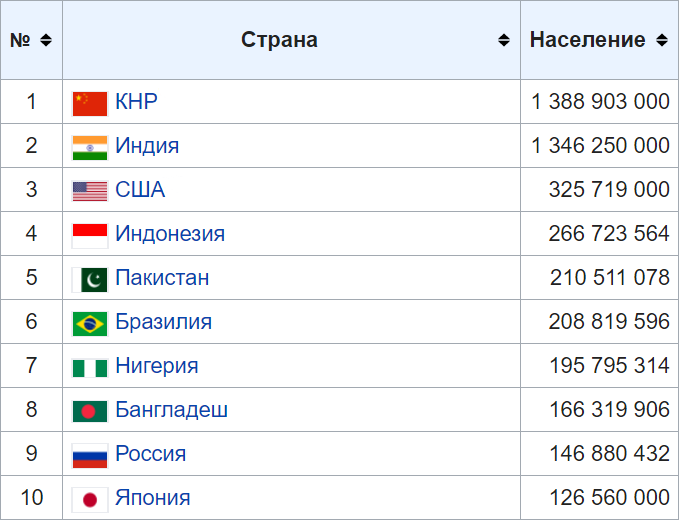
The US population is 2,2 times larger than ours, and the Chinese population is 9,38 times larger. This means that the volume of real industrial production in Russia and the United States per capita is approximately the same.
The claim of much more efficient production in the United States turns out to be a myth.
Similarly, in terms of per capita, we produce an industrial product 1,26 times more than in China.
PPP makes it possible to estimate the real volume economics without reference to the dollar, as well as the real standard of living in the country. A knowledge of the structure of the gross domestic product of the country allows you to highlight the volume of the real sector, i.e. actual manufactured product in various industries: mining and manufacturing.
There are more complex translation techniques, including more parameters that we do not consider here.
So, let's compare the GDP of Russia, the USA and China and draw some unexpected conclusions.
Gross domestic product at purchasing power parity in billions of dollars (IMF data for 2016)
GDP structure
USA. Industrial production - 15%, agriculture and fisheries - 1%, construction - 3%. Total real sector - 19%. The rest is trade and various kinds of services: from manicure to transport and financial.
China. Industrial production - 40%, agriculture - 10%, construction - 7%. The share of the real sector is 57%. It turns out that the size of the real sector of China's economy is almost three times larger than the American one.
Russia. Industrial production - 30,5%, agricultural and fishing - 4,2%, construction - 7,4%. Total - 42.1%
So, let's count. US GDP is 4,8 times more than ours, and the specific share of real production in Russia's GDP is 2,2 times higher than in US GDP. This means that real industrial production in the USA is 4.8 / 2.2 = 2.18 times larger than ours. And if we take into account the shadow sector, which in Russia is significantly larger than in the US, the gap will become even less noticeable.
A similar calculation for China shows that the volume of the manufactured product there is 7,44 times higher than ours.
In terms of per capita, we come to interesting and unexpected conclusions.
Country Population 2017
The US population is 2,2 times larger than ours, and the Chinese population is 9,38 times larger. This means that the volume of real industrial production in Russia and the United States per capita is approximately the same.
The claim of much more efficient production in the United States turns out to be a myth.
Similarly, in terms of per capita, we produce an industrial product 1,26 times more than in China.
- Evgeny Frolov
- http://www.acexpert.ru/
Information